What’s Wrong with AI Tool Usage Dashboards
Boris Cherny, the creator of Claude Code — Anthropic’s flagship coding tool — outlined a problem in a series of publications that applies equally to editorial teams: usage measures activity, not return. A dashboard showing how many tokens your team burned in a week, how many prompts were sent, and how many documents were generated answers the question “what is the team doing?” but not “what is the team getting in return?”.
For content teams, this is especially critical. An editor who generated 40 article drafts in a month didn’t necessarily produce 40 publish-ready pieces. Some might have been rejected during fact-checking, some sent back for revision due to banality, and some rejected for originality issues. Token burn rises, but the actual content output might remain the same or even drop because the team spends time revising low-quality drafts instead of writing independently.
The key question Cherny suggests asking instead of “how many tokens did we spend” is: “would we have had to spend engineering resources on this task if there was no AI?”. For editorial teams, it translates to: “how many hours would this task have taken an editor/writer/fact-checker without AI, and how many with AI?”.
Why Token Burn Is a Bad Metric for Content Teams
Token burn is a consumption metric. It shows how much “raw material” the model processed, but says nothing about:
- Output quality. 100,000 tokens can yield one strong analytical article or ten banal reviews that won’t pass the editorial filter.
- Rejection rate. If 60% of generated drafts go to the trash, token burn rises, but net output doesn’t.
- Revision time. An AI draft requiring four hours of fact-checking and structural editing might be more expensive than writing manually from scratch.
- Cannibalization. If a writer uses AI for a task they could handle in 20 minutes manually, the net gain is zero or negative (minus the API cost and context switching).
In content operations, token burn is only useful as a technical budgeting metric — for controlling API costs and planning limits. But as a success metric, it’s misleading.
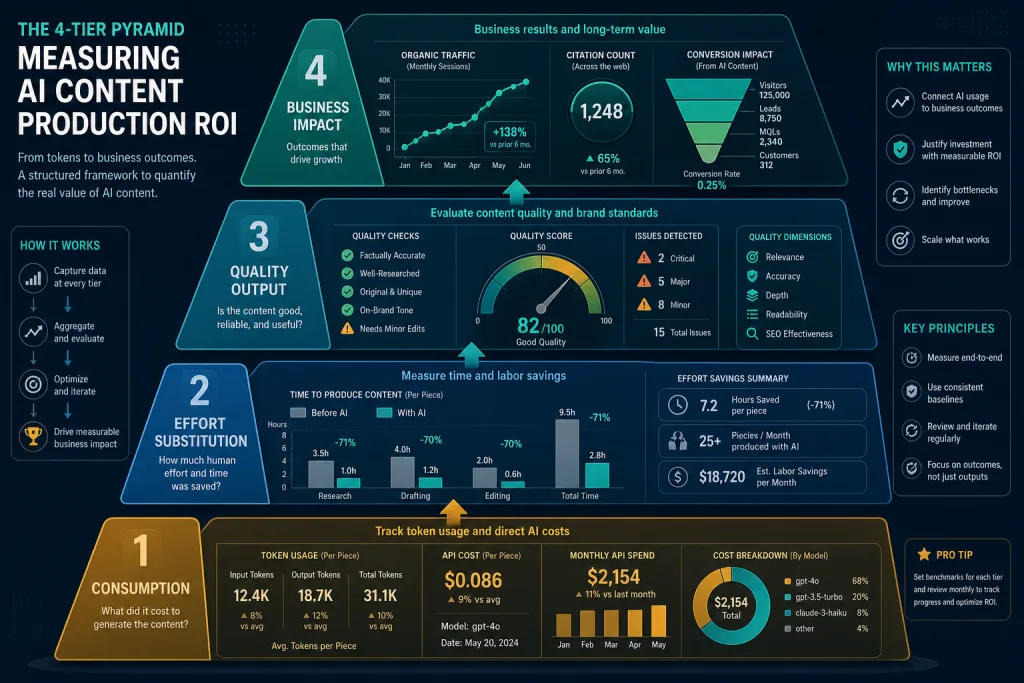
Four Levels of Metrics for AI Content Production
Building on Cherny’s four-step framework and adapting it for editorial workflows, we can identify four levels of measurement:
Level 1: Consumption Metrics (Technical)
The base layer needed for budgeting, not for evaluating results:
- Token volume by task type (drafting, revision, summarization, fact-checking)
- Number of API calls per user/team
- API cost per content unit (article, page, piece)
- Usage distribution across tools (Claude, GPT, Gemini, Perplexity)
This data shows where AI is applied, but not how effectively.
Level 2: Effort Displacement Metrics
The key level. This measures how much human time AI actually saved. Methodology:
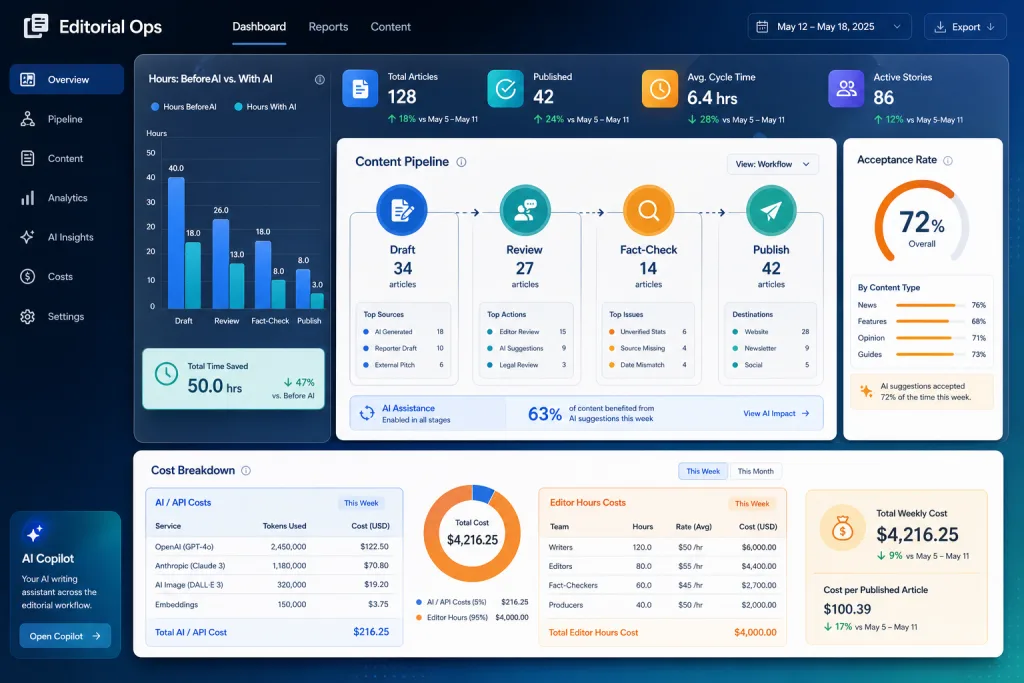
- Baseline assessment. For each content category, a “pre-rocket” norm is recorded — how many hours a writer/editor spent on a given type of article before AI adoption.
- Current assessment. After implementing the AI pipeline, the actual time for the same content type is measured — including prompting, revision, fact-checking, and final editing.
- Net savings = baseline assessment − current assessment − time spent working with AI.
Example: an industry review article previously took 8 hours of writer time + 2 hours of editor time = 10 hours. With an AI pipeline (prompt template → draft → structural edit → fact-checking) — 2 hours of writer time for prompting and revision + 1.5 hours of editor time + 0.5 hours of fact-checker time = 4 hours. Net savings are 6 hours per article, or 60%.
Important: if the time spent working with AI plus revision yields negative savings — the task isn’t suitable for AI automation. That’s normal. Not every content type benefits from generative AI.
Level 3: Output Quality Metrics
Saving time is meaningless if quality drops. Quality metrics must be measured alongside speed metrics:
- First-pass acceptance rate. The percentage of AI-assisted drafts that pass the editorial filter without significant rework. A low percentage means the prompt system or model isn’t handling the task well.
- Editor ratings (blind comparison). The editor rates an article without knowing if it’s AI-assisted or fully manual. If AI versions consistently get lower scores — the problem is quality, not speed.
- Originality metrics. The percentage of pieces passing plagiarism/AI-detection checks without flags. An increase in flags means the model is reproducing patterns detectors recognize as synthetic.
- E-E-A-T scoring. Expertise, Experience, Authoritativeness, Trustworthiness — a subjective but systematic assessment by the editor on a 1–5 scale for each piece.
Level 4: Business Impact Metrics
The final level — linking content production to results that matter to the business:
- Organic traffic to AI-assisted content vs. manual content (adjusted for indexing time and age)
- Citation rate in AI answer engines — whether the content is mentioned in ChatGPT, Perplexity, Gemini responses
- Time-to-publish — whether the production cycle is shrinking without quality loss
- Content portfolio volume — whether the AI pipeline allows expanding the portfolio without proportional headcount growth
- Content conversions — leads, subscriptions, sign-ups that can be attributed to specific pieces
How to Build a Measurement System: A Practical Approach
Step 1: Content Categorization
Divide all content into types: news briefs, analytical articles, product reviews, guides/tutorials, longreads, knowledge base. Each type has its own “pre-rocket” norm and its own AI suitability assessment. A news brief might barely benefit from AI (fact-checking eats the savings), while a knowledge base might benefit exponentially.
Step 2: Task Tagging
Every AI-assisted task must be tagged: content type, workflow stage (research, draft, revision, fact-checking, localization), tool used, prompt template. This allows slicing the data to see where AI delivers maximum return and where it delivers minimum.
Step 3: Time Logging
Minimum viable setup: the writer and editor log actual time per piece, broken down by stages. No need to track every minute — 15-minute accuracy is enough. In 2–3 months, enough data accumulates for statistically significant conclusions.
Step 4: Quarterly ROI Audit
Once a quarter, compare:
- Baseline norms vs. current time spent per content type
- Quality (acceptance rate, editor ratings, originality)
- Business metrics (traffic, citations, conversions)
- API cost vs. person-hours saved
If the monetary value of person-hours saved is less than the API cost + overhead for managing the AI pipeline — the ROI is negative, and you either need to optimize the prompt system or abandon AI for that content type.
Common Measurement Traps
Trap 1: Measuring only speed. “We write articles 3 times faster” is meaningless without a quality metric. If faster — but worse — you’re degrading your portfolio.
Trap 2: Ignoring overhead. Setting up prompt systems, training the team, maintaining templates, managing API keys — these are all hidden costs. If one editor spends 20% of their time maintaining AI infrastructure, this needs to be accounted for.
Trap 3: Comparing the incomparable. An AI-assisted longread and a manual news review are different content types. Compare within the same category.
Trap 4: Ignoring cannibalization. If a writer uses AI for a task they would do manually in 15 minutes, but spends 10 minutes prompting + 5 minutes revising — the net gain is zero, and the risk of introducing an error is non-zero.
Trap 5: Calculating savings based only on salary. An editor’s hour costs not just their salary — it’s also opportunity cost. The time freed up by AI must be redirected to higher value-added tasks: original research, interviews, expert columns. If the freed time is just “saved” — you’re missing out on ROI.
When the ROI of an AI Content Pipeline Is Negative — and That’s Okay
Not every content type benefits from AI. Practice shows that:
- News briefs often don’t yield a positive ROI — fact-checking eats up the time saved.
- Opinion columns and editorials — AI here is more of a hindrance than a help, because the value lies in the author’s voice, not the structure.
- Short reference materials — if a writer can draft a reference in 10 minutes, AI prompting + revision will take just as long or longer.
Positive ROI most often occurs in:
- Knowledge bases and guides — structured, formatted content where AI accelerates drafting 3–5 times.
- Localization and adaptation — translating and adapting long materials into new languages.
- Systematizing large data volumes — summarizing research, compiling sources, preparing reviews.
- Template-based reviews — products, services, comparisons — where the structure is repeatable and fact-checking is minimal.
Connection to AI Search Visibility
Business impact metrics (Level 4) are directly tied to how AI answer engines perceive your content. If AI-assisted materials get more citations in Perplexity and ChatGPT than manual ones — this might indicate that the prompt system structures content better for machine reading. But it might also indicate that AI content is more banal and easier to cite — which isn’t necessarily good for the brand.
Key principle: visibility metrics must be separated by content type and production method. Only then can you understand if AI production gives a real advantage in discoverability or just produces more “citation noise”.
Checklist: How to Launch ROI Measurement for Your AI Content Pipeline
- Categorize all content types in your portfolio — at least 5–7 categories with different production norms.
- Record “pre-rocket” time norms for each category — based on data from the last 3–6 months.
- Tag every AI task: content type, workflow stage, tool, prompt template — without tags, data is insufficient.
- Log actual time with 15-minute accuracy — writer, editor, fact-checker separately by stages.
- Measure the first-pass acceptance rate — if it’s below 50%, the prompt system needs reconfiguration.
- Conduct a quarterly audit: time saved × hourly cost − API cost − overhead = net ROI.
- If ROI is negative for a content type — don’t try to “improve prompts”, the task might just not be suitable for AI.
Practice: What Implementation Experience Shows
Teams that implement systematic ROI measurement usually discover one of three scenarios:
Scenario A: “Exceeding expectations”. AI delivers 40–60% time savings on knowledge bases and guides while maintaining quality. Net ROI is positive. Recommendation — expand the AI pipeline to adjacent categories.
Scenario B: “Illusion of speed”. Speed increased, but quality dropped — first-pass acceptance rate is below 40%, editor ratings are lower than manual. Net ROI is negative or zero. Recommendation — review the prompt system, introduce mandatory human-in-loop at the structure stage, or abandon AI for this type.
Scenario C: “Targeted win”. AI yields a positive ROI on 2–3 content categories and negative on the rest. This is the most common and realistic picture. Recommendation — focus AI on winning categories, don’t try to automate everything.
Scenario C is exactly the right goal for implementation. Trying to “automate all content” is a utopia that leads to token burn inflation without increasing real output.
FAQ
How does the ROI of AI content production differ from a standard editorial productivity metric?
AI production ROI measures the net difference between costs with and without AI — including API costs, pipeline management overhead, and revision time. Standard productivity calculates content output per unit of time without considering the production method.
How much data needs to be accumulated for statistically significant conclusions?
At least 2–3 months and 30–50 pieces per category. Less — the data is noisy; more — you risk taking too long to make decisions about inefficient pipelines.
What to do if token burn is rising, but net content output isn’t increasing?
This is a signal that the team is using AI for tasks that don’t yield savings. Slice the data by content types and workflow stages — you’ll likely find categories where AI cannibalizes time instead of saving it.
Do we need to measure the ROI of different AI tools (Claude, GPT, Gemini) separately?
Yes, if the team uses multiple models. Different models deliver different quality on different content types — Claude might be stronger in analytics, GPT — in template texts. Without separate measurement, you aren’t optimizing task distribution.
How to account for the opportunity cost of freed-up time in ROI calculation?
If freed hours are redirected to higher value-added content (research, interviews, expert materials) — it’s an extra plus to ROI. If the time is just “saved” and not redirected — the opportunity cost is zero and ROI only accounts for direct savings.