What is Synthetic AI-Visibility Benchmarking and Why Newsrooms Need It
External LLM-SEO tools — Profound, AthenaHQ, LLM Ranker, and others — provide a convenient proxy for tracking content visibility in ChatGPT, Perplexity, and Gemini answers. But they have a fundamental limitation: they only cover the engines and query types they support and don’t allow control over experimental conditions. You can’t test how changing an article’s structure affects citability without first publishing it and waiting for reindexing.
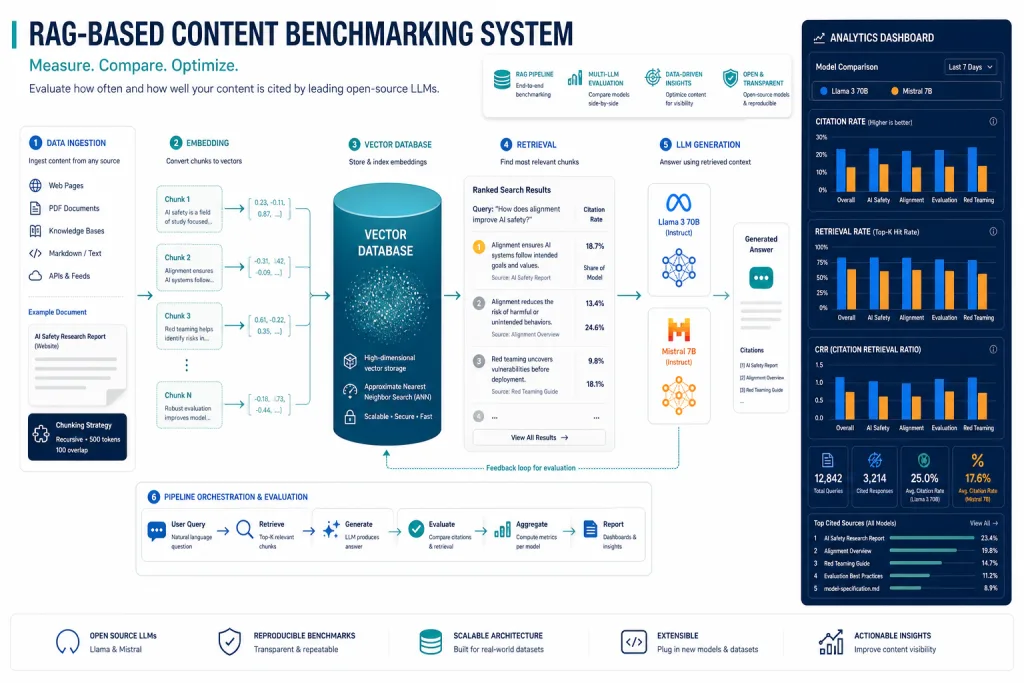
Synthetic benchmarking solves this problem. A content team builds an internal RAG (Retrieval-Augmented Generation) prototype on their own content corpus and an open-source LLM — Llama, Mistral, Qwen — which simulates generative search in a controlled environment. You upload articles, formulate queries, and the model generates answers with citations from your corpus. This allows you to measure how often specific articles are cited, compare structural and formatting variations, and do it all before publication.
The key difference from external tools: you control the corpus, the model, the retrieval prompt, and the generation parameters. This isn’t equivalent to production generative search — ChatGPT and Perplexity use their own indexes, ranking, and filters — but it provides a reproducible benchmark for A/B testing content decisions.
Why External LLM-SEO Tools Aren’t Enough
The LLM-SEO tool market has grown rapidly, but coverage remains fragmented. Here are the specific limitations content teams face:
- Scanning frequency. Most platforms poll AI engines once every 1–2 weeks. For a newsroom publishing 20–30 articles a month, this means a feedback delay of 2–4 weeks.
- Query limits. Platforms price by the number of tracked prompts. A team of 5 editors with 200 target queries quickly hits the limits.
- Lack of contextual testing. You can’t upload a draft article to Profound and check if it will be cited. The tools only work with published content.
- Ranking opacity. External tools don’t show why article A is cited and article B isn’t. You see the result, but not the factors.
A synthetic benchmark closes these gaps: you test drafts, control variables, and get detailed retrieval tracing.
RAG Prototype Architecture for Content Teams
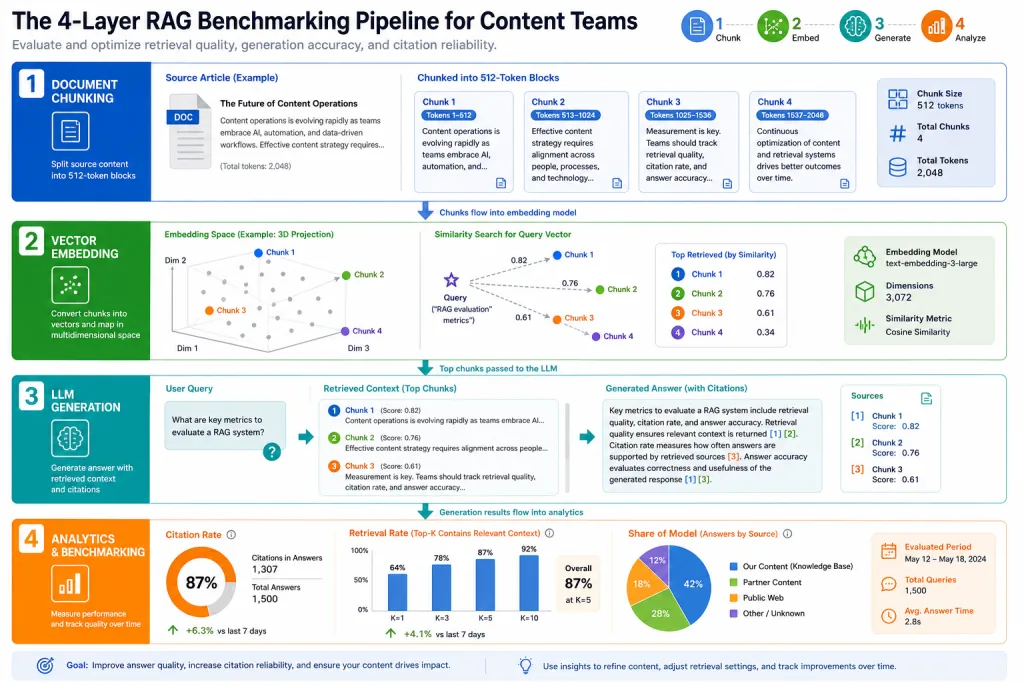
A minimal RAG prototype for benchmarking consists of four components:
1. Vector Content Store
Each article is split into chunks (512–1024 token fragments with a 10–15% overlap). Each chunk is embedded and saved to a vector database — ChromaDB, Qdrant, Weaviate, or pgvector in PostgreSQL. Chunk metadata includes the article URL, title, section, publication date, and tags.
2. Retrieval Layer
Upon receiving a query, the system converts it to an embedding and retrieves the top-K relevant chunks (usually K=5–10). This simulates the first stage of generative search — finding candidates for the answer.
3. Generation with Citations
The open-source LLM receives a prompt: “Answer the user’s question using only the provided context. Cite a source for every statement.” The model generates an answer and references chunk metadata — the article URL and title.
4. Analytics Layer
The system logs: which chunks were retrieved, which chunk was cited in the answer, which query triggered the citation, and the chunk’s rank in the retrieval results. This provides citation rate, retrieval rate, and share of model metrics.
Choosing an Open-Source LLM for Benchmarking
The choice of model affects the simulation quality. Three factors are crucial for content teams: generation quality, ability to cite sources, and hosting costs.
Llama 3.1 (8B/70B) — a balanced choice. 70B offers quality close to GPT-4 but requires a GPU with 48+ GB VRAM. 8B runs on a single T4 and is sufficient for basic structure testing and retrieval.
Mistral Large / Mixtral 8x7B — good citability thanks to the mixture-of-experts architecture. Mixtral runs on 2×A100 and shows stable results in RAG tasks.
Qwen 2.5 (72B) — a strong multilingual model. If the content team works with Russian, Spanish, or Chinese, Qwen often outperforms Llama on non-English corpora.
Practical recommendation: start with Llama 3.1 8B on a single GPU for the prototype. Once metrics stabilize, upgrade to 70B or Mixtral for final testing.
Synthetic Benchmarking Metrics
A RAG prototype provides metrics that external tools lack:
- Citation Rate (CR) — the percentage of queries where an article is cited at least once. CR = (queries with citation / total queries) × 100%.
- Retrieval Rate (RR) — the percentage of queries where an article’s chunk makes it into the top-K retrieval. RR shows whether the article passes the first filter of generative search.
- Citation-to-Retrieval Ratio (CRR) — CR / RR. Shows how well an article “converts” retrieval into citation. A low CRR means the article is retrieved, but the model doesn’t select it for the answer.
- Share of Model (SoM) — the article’s share of total citations on a topic. Just like Share of Search in classic SEO, but for AI answers.
- Chunk Position — the average position of an article’s chunk in the retrieval results. The higher the position, the better the chances of being cited.
These metrics allow you to diagnose specific issues. Low RR — a content relevance problem. High RR, low CRR — a format or answer clarity problem. Low SoM with high CR — competitors are cited more often.
Practical Scenario: Testing Article Structure
Consider a real case. A SaaS platform’s content team publishes an article titled “What is DCB Monetization”. The editor wants to check if the article will be cited in responses to the query “how direct carrier billing works”.
Step 1. Load 50 articles on the topic (your own + top-10 Google competitors) into the RAG prototype.
Step 2. Formulate 20 query variations: “what is DCB”, “how does operator billing work”, “direct carrier billing explained”, “DCB monetization flow”, etc.
Step 3. Run the benchmark and get baseline metrics. Let’s say the article’s CR = 15%, RR = 40%, CRR = 37.5%.
Step 4. Restructure the article: move the definition to the first paragraph, add a comparison table for DCB and premium-SMS, add explicit entities (operator names, platforms, geographies).
Step 5. Reload the updated version and repeat the benchmark. If CR jumps to 35% and CRR to 70%, the structural change works.
This takes 2–3 hours instead of 2–4 weeks waiting for an external tool.
Limitations and Risks of Synthetic Benchmarking
A synthetic benchmark is a lab experiment, not production data. It’s important to understand the boundaries of applicability.
The index doesn’t match. Your RAG prototype only contains your corpus. ChatGPT and Perplexity index the entire web. An article that isn’t cited in your benchmark might be cited in production because it has external signals — backlinks, brand queries, social mentions.
Ranking differs. External AI engines use their own retrieval algorithms — often hybrid (vector + BM25 + re-ranking). Your prototype might use pure vector search, yielding different results on the same chunks.
The model doesn’t match. Llama 70B and GPT-4o formulate answers differently and choose sources differently. Results on Llama correlate with GPT-4, but aren’t identical.
Infrastructure cost. Hosting Llama 70B on AWS or RunPod costs $2–4 per hour. For weekly benchmarking of 200 queries, that’s $20–40 per month — acceptable for a mid-sized newsroom. But for daily testing of 1000+ queries, the cost scales up.
Recommendation: use the synthetic benchmark as a supplement, not a replacement for external tools. The benchmark is for A/B testing decisions before publication. External tools are for monitoring real visibility after publication.
Integration into the Editorial Workflow
Synthetic benchmarking is only useful if integrated into the process. Here’s how it looks in the editorial cycle:
Planning. When selecting topics, the content strategist runs a benchmark on 10–15 target queries. If competitors’ RR is low (<30%), the topic is promising — content can quickly capture citations. If RR is high (>70%), the topic is saturated.
Draft. The editor uploads a draft to the RAG prototype before review. The benchmark shows whether the key chunk is retrieved and cited. If not, the editor adjusts the structure before publication, not after.
Update. When updating an old article, the benchmark compares the old and new versions. If CR didn’t increase, the update didn’t help AI visibility.
Monthly audit. The team runs a benchmark across the entire portfolio and compares SoM to the previous month. A drop in SoM on a specific topic is a signal to update the content.
Comparison with External LLM-SEO Tools
| Criterion | Synthetic Benchmark | External Tools (Profound, AthenaHQ) |
|---|---|---|
| Draft testing | Yes, pre-publication | No, published content only |
| Variable control | Full (model, prompt, corpus) | Limited |
| Query coverage | Unlimited | Priced by prompt count |
| Match to production search | Low (simulation) | High (real queries) |
| Cost | $20–100/mo (GPU) | $100–500/mo (subscription) |
| Feedback speed | Minutes | Days–weeks |
| Retrieval tracing | Full | Unavailable |
The two approaches aren’t mutually exclusive. The synthetic benchmark optimizes the content creation process. External tools measure the real-world result.
Practice for Content Teams: Launch in One Sprint
Building a RAG prototype takes 1–2 sprints for a team with basic Python skills. Here’s the minimal stack:
- Embeddings: sentence-transformers (all-MiniLM-L6-v2 model for English, intfloat/multilingual-e5-base for multilingual content)
- Vector database: ChromaDB (local, serverless) or Qdrant (for scale of 10,000+ articles)
- LLM: Llama 3.1 8B via Ollama (locally) or via Together.ai / Groq API
- Orchestration: LangChain or LlamaIndex for the retrieval → generation pipeline
- Analytics: Pandas + Streamlit dashboard for metric visualization
Prototype budget: $0 if run on a local GPU machine, or $30–50/mo on a cloud GPU (RunPod, Lambda Labs).
Checklist: Launching Synthetic AI-Visibility Benchmarking
- Collect a corpus of 50–200 articles (your own + top competitors) in Markdown or JSON format with metadata
- Split articles into 512–1024 token chunks with a 10–15% overlap and save section metadata
- Choose an embedding model: all-MiniLM-L6-v2 for English, multilingual-e5 for multilingual content
- Launch a vector database (ChromaDB for prototype, Qdrant for scale) and load the chunks
- Configure LLM generation with a prompt requiring a source citation for every statement
- Formulate a set of 20–50 target queries and run a baseline benchmark
- Integrate benchmarking into draft reviews: the editor checks CR and CRR before publication
What to Measure First
When launching the benchmark, don’t try to track all metrics at once. Start with three:
-
Retrieval Rate across top 20 queries — shows if your content passes the first filter. If RR is < 20% for most queries, the problem is content relevance.
-
Citation-to-Retrieval Ratio — shows if content converts retrieval into citation. CRR < 30% means content is retrieved, but the model doesn’t select it for the answer. This is usually a format issue: no direct answer, entity isn’t defined, chunk is too long.
-
Share of Model across 5 key topics — shows your citation share relative to competitors. SoM < 10% on a topic with high competitor RR is a signal to update content.
These three metrics provide 80% of the diagnostic value. Add other metrics — chunk position, per-query CR, temporal trends — after the baseline stabilizes.
FAQ
How does a synthetic benchmark differ from standard content A/B testing?
A synthetic benchmark tests LLM behavior, not user behavior — how the model retrieves and cites content. A/B testing measures human conversions and engagement. The benchmark measures citability in generative search. These are different metrics and different decisions.
Does a dev team need to build a RAG prototype?
A minimal prototype on LangChain + ChromaDB + Ollama can be assembled in 1–2 days with basic Python skills. If the team has a content strategist or editor with technical skills, a separate developer isn’t needed. Scaling to 10,000+ articles will require engineering support.
How often should the benchmark be run?
At a minimum, once a month for a portfolio audit. With active content production — during every draft review. A full benchmark of 200 queries on Llama 8B takes 15–30 minutes, on 70B — 1–2 hours.
Can the benchmark be used for multilingual content?
Yes. Use multilingual-e5-base for embeddings and Qwen 2.5 or Llama 3.1 for generation. Load articles in different languages into separate vector database collections and test citability by language segment separately.
Does a synthetic benchmark replace external LLM-SEO tools?
No. The benchmark is for optimizing content before publication. External tools are for monitoring real visibility after publication. Use both: the benchmark as a production tool, external tools as a measurement tool.